
Data Studio
All your research
tools in one platform.
The Data Studio unlocks tools that make your property selection and assessment faster and easier.
Trusted by:


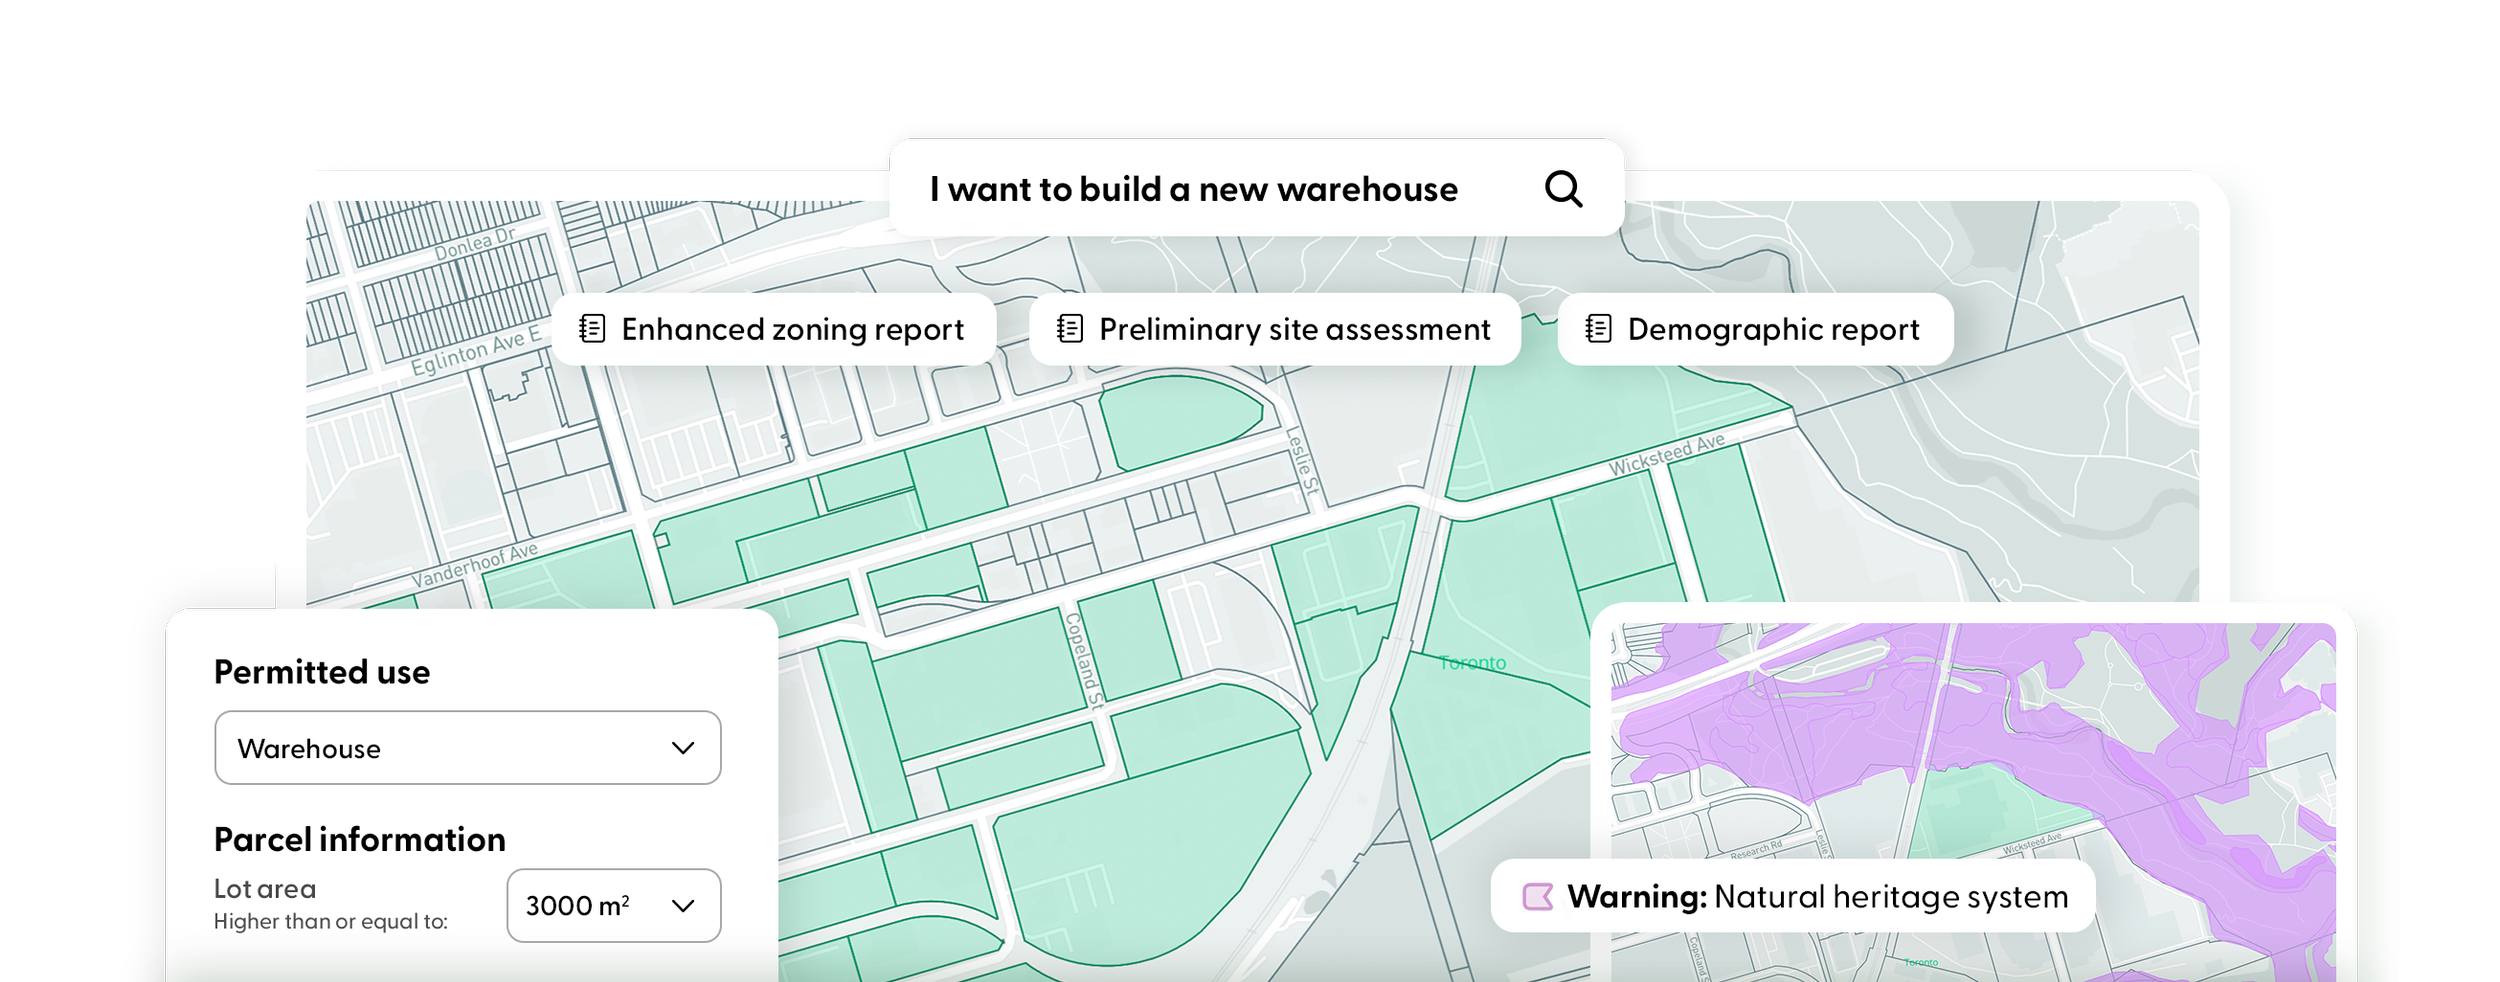
Main portal
Search by address.
It’s easy to get started. Just search for an address in the main portal and instantly see which reports and tools are available for that location. Or, if you want to start broad and filter down, head over to the site selection tool!
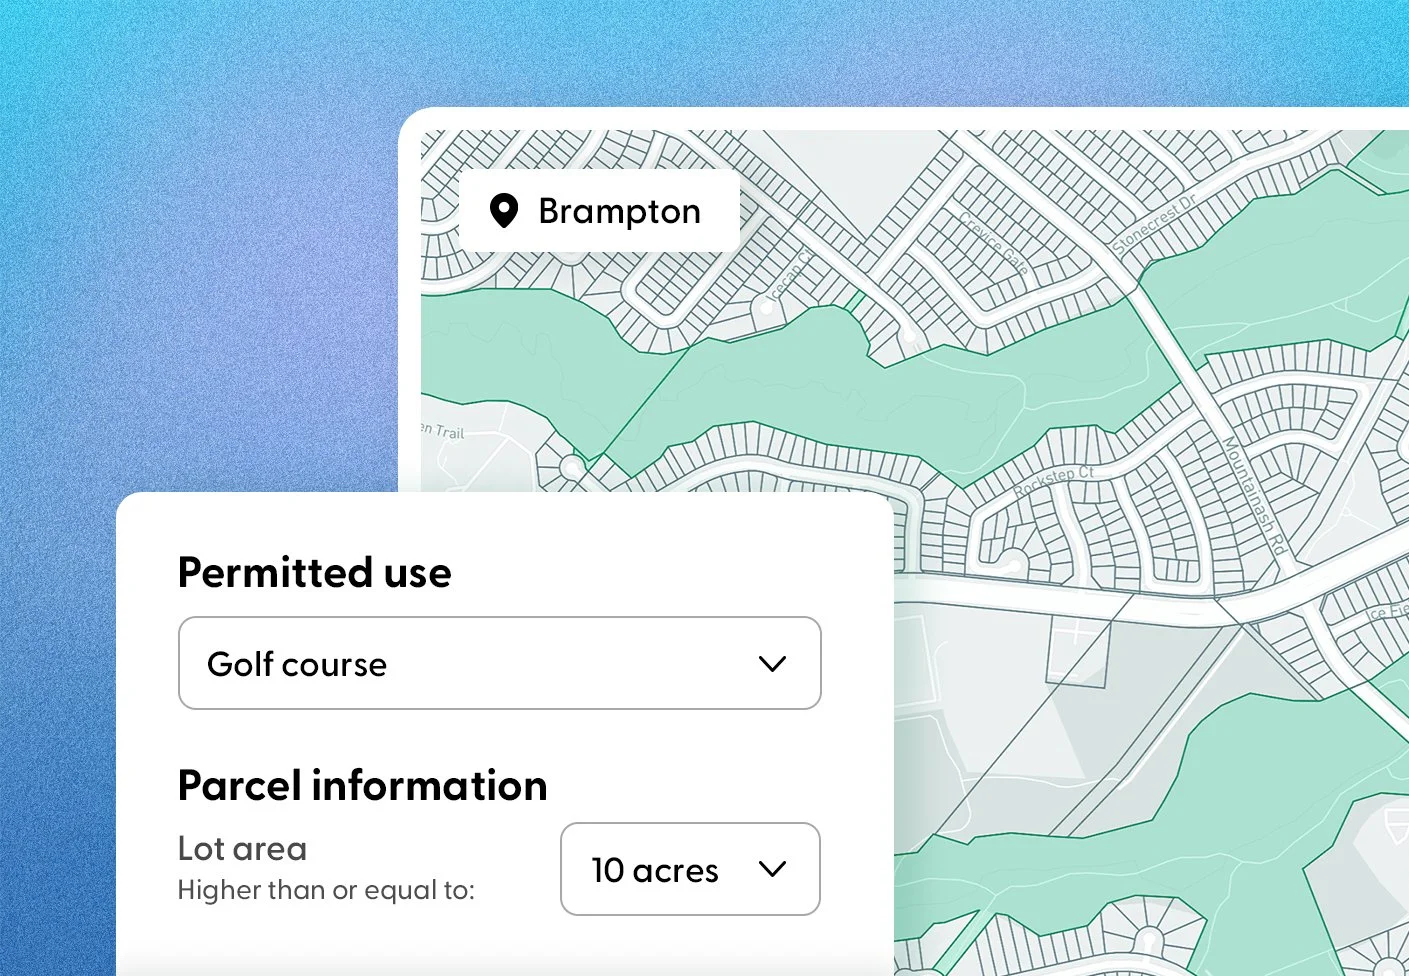
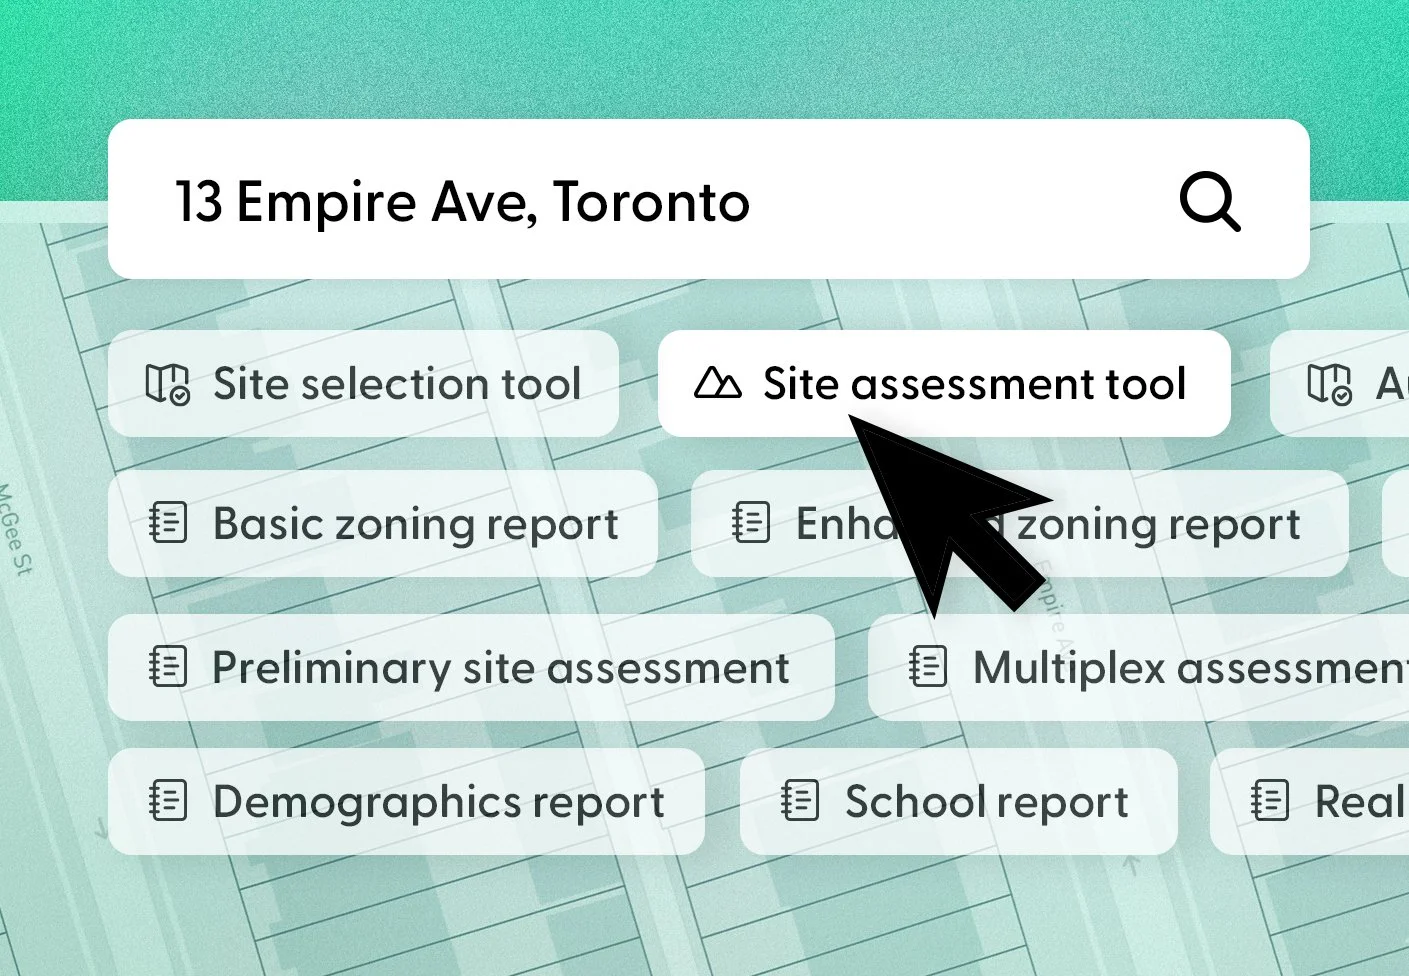
Site selection
Search by your needs.
With site selection, you can search by intended use, zone code, building type, measurements, and more! Cut down on your research time, and find sites quickly, easily and accurately. Want even more zoning insight? Download the full zoning report.

Site assessment
Assess risks and constraints.
Easily toggle through the constraints affecting your property. Explore flooding, heritage, conservation, land-use, development activities, and more! Looking for a complete summary? Just download a Preliminary Site Assessment to see everything all at once.
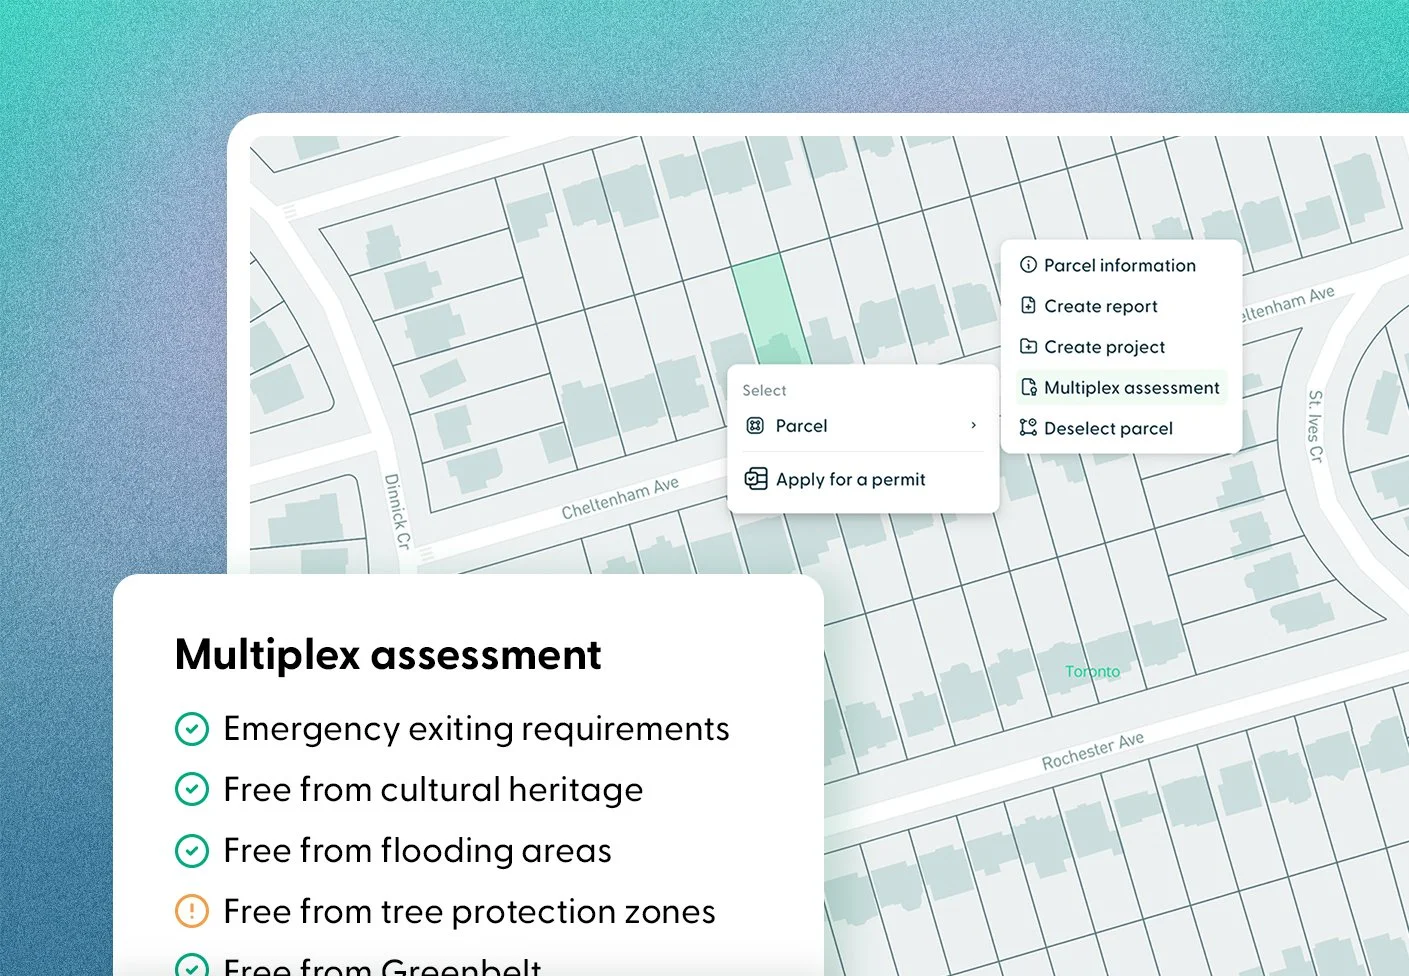
Multiplex assessment
Jump-start your multiplex.
Assess whether a lot can support a multiplex, and highlight key constraints early. Just select a property and generate an assessment. This removes guesswork and saves time in making go/no-go decisions.
Property reports
Click-and-go property reports.
With a Data Studio subscription you can buy any report at a discount. Just log in, select a property, and download. Don’t have a subscription, but still want reports on-demand? No problem, we’ve got you covered.

Tim Rye, Senior Vice President
Commercial Solutions, Teranet Inc.
With LandLogic’s reports embedding directly into our platform, zoning insight is now a few clicks away in GeoWarehouse. Real Estate Professionals can quickly verify designations and constraints without hunting through bylaws, which streamlines due diligence and reduces risk.
Brokerage features
Delivering faster,
easier agent workflows.
By signing up for a brokerage subscription, you unlock agent-specific tools that will upgrade your workflows in ways you’ve never seen before.
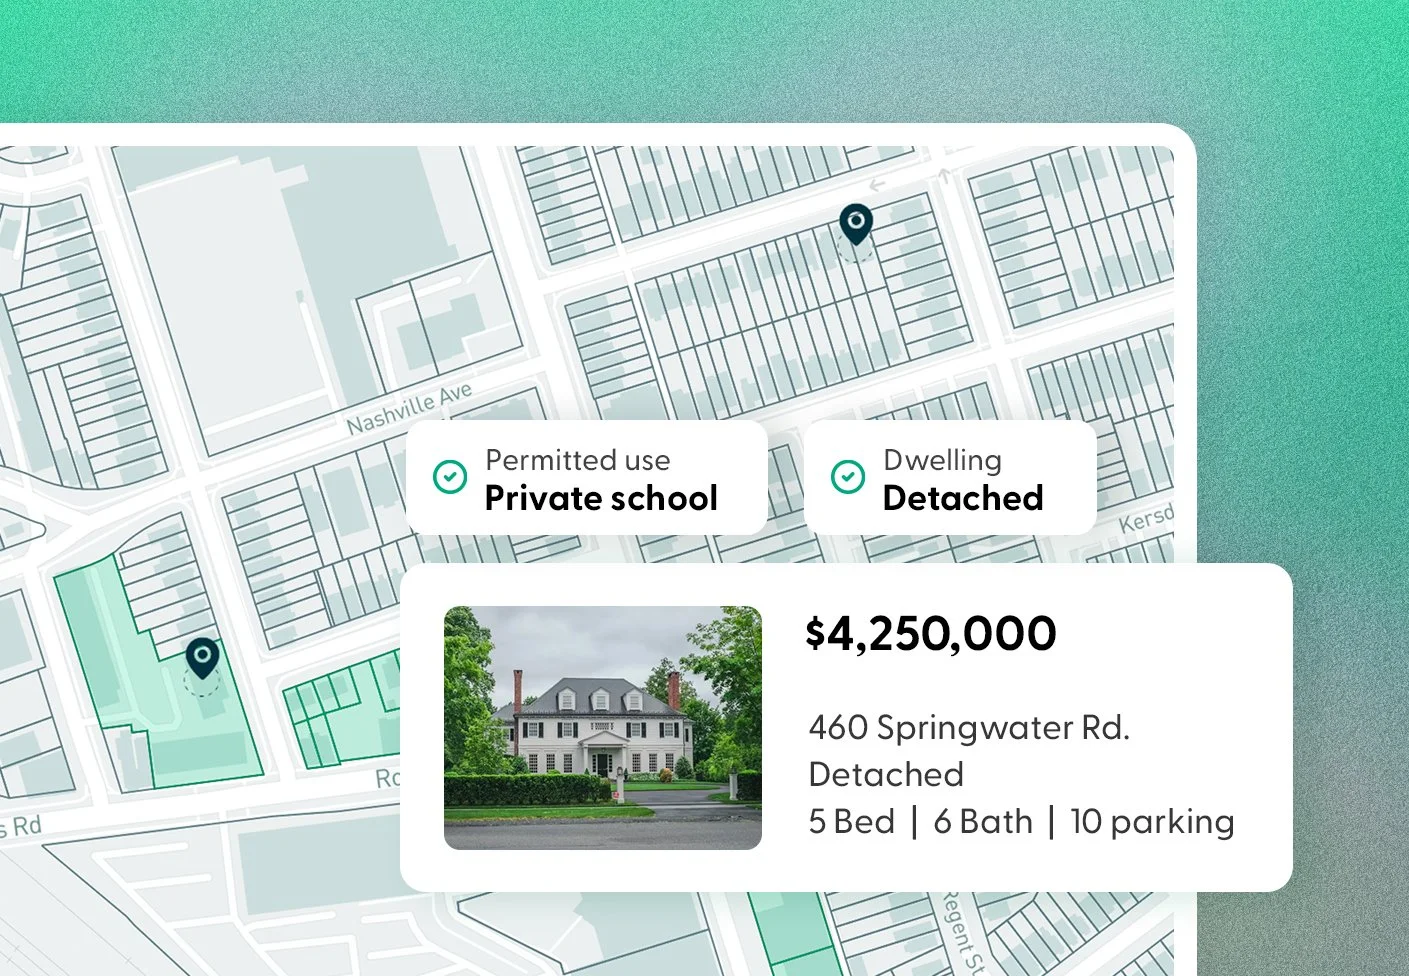
Active listings
Find listings fast with site selection.
Get everything site selection offers, but with the ability to filter sale and lease listings. A one-stop-shop for finding the right sale with the right land use and zoning details.
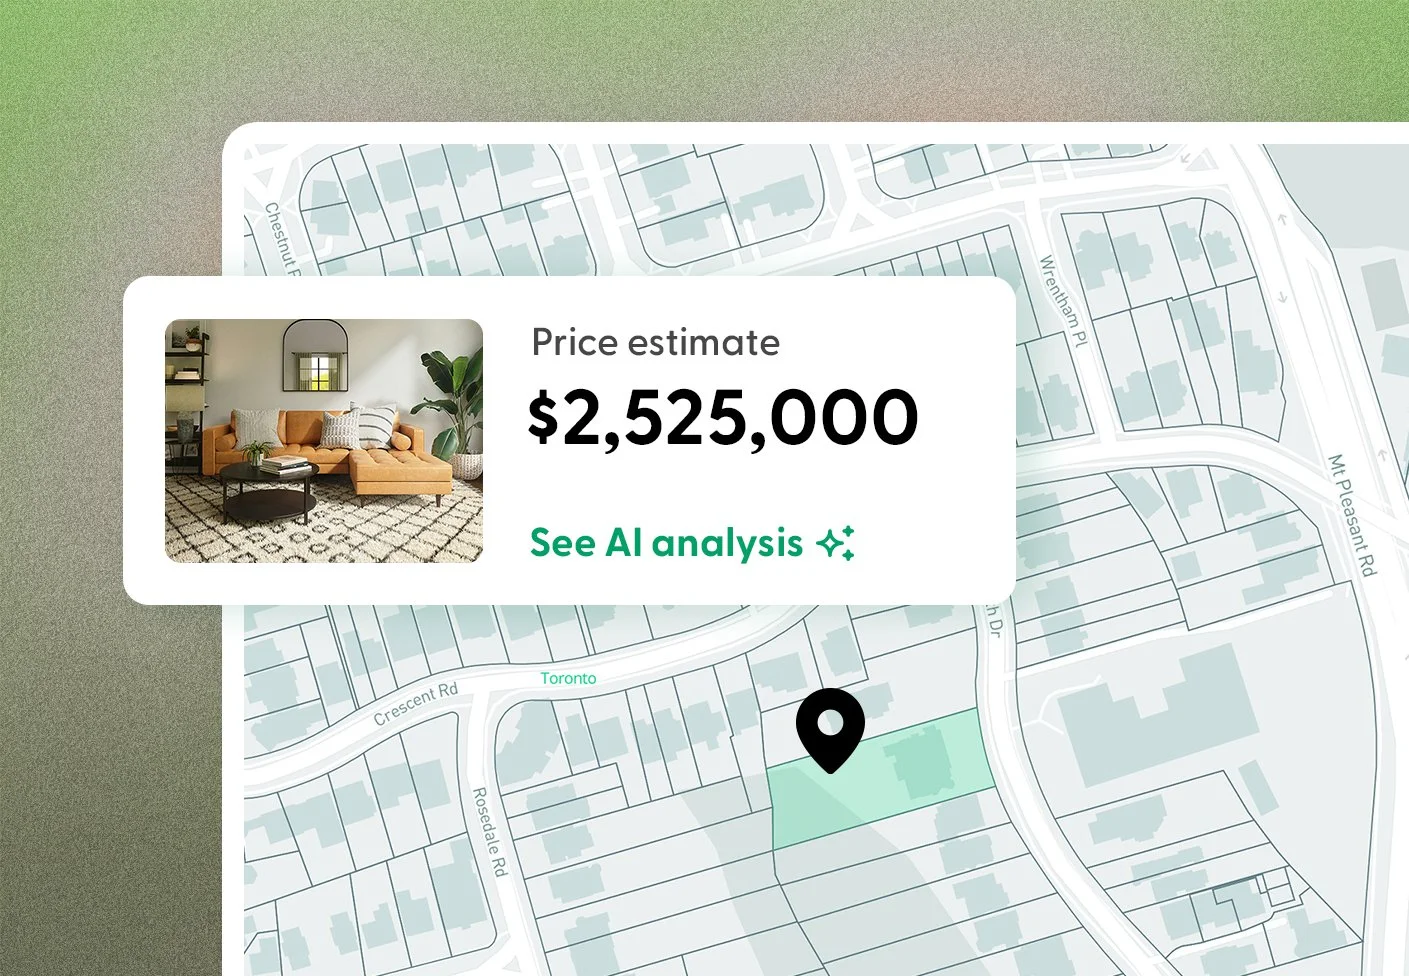
Price estimator
Easy price predictions.
Realtors can get an accurate estimation of property value that use LandLogic's AI-powered engine to produce results that no one else can match.
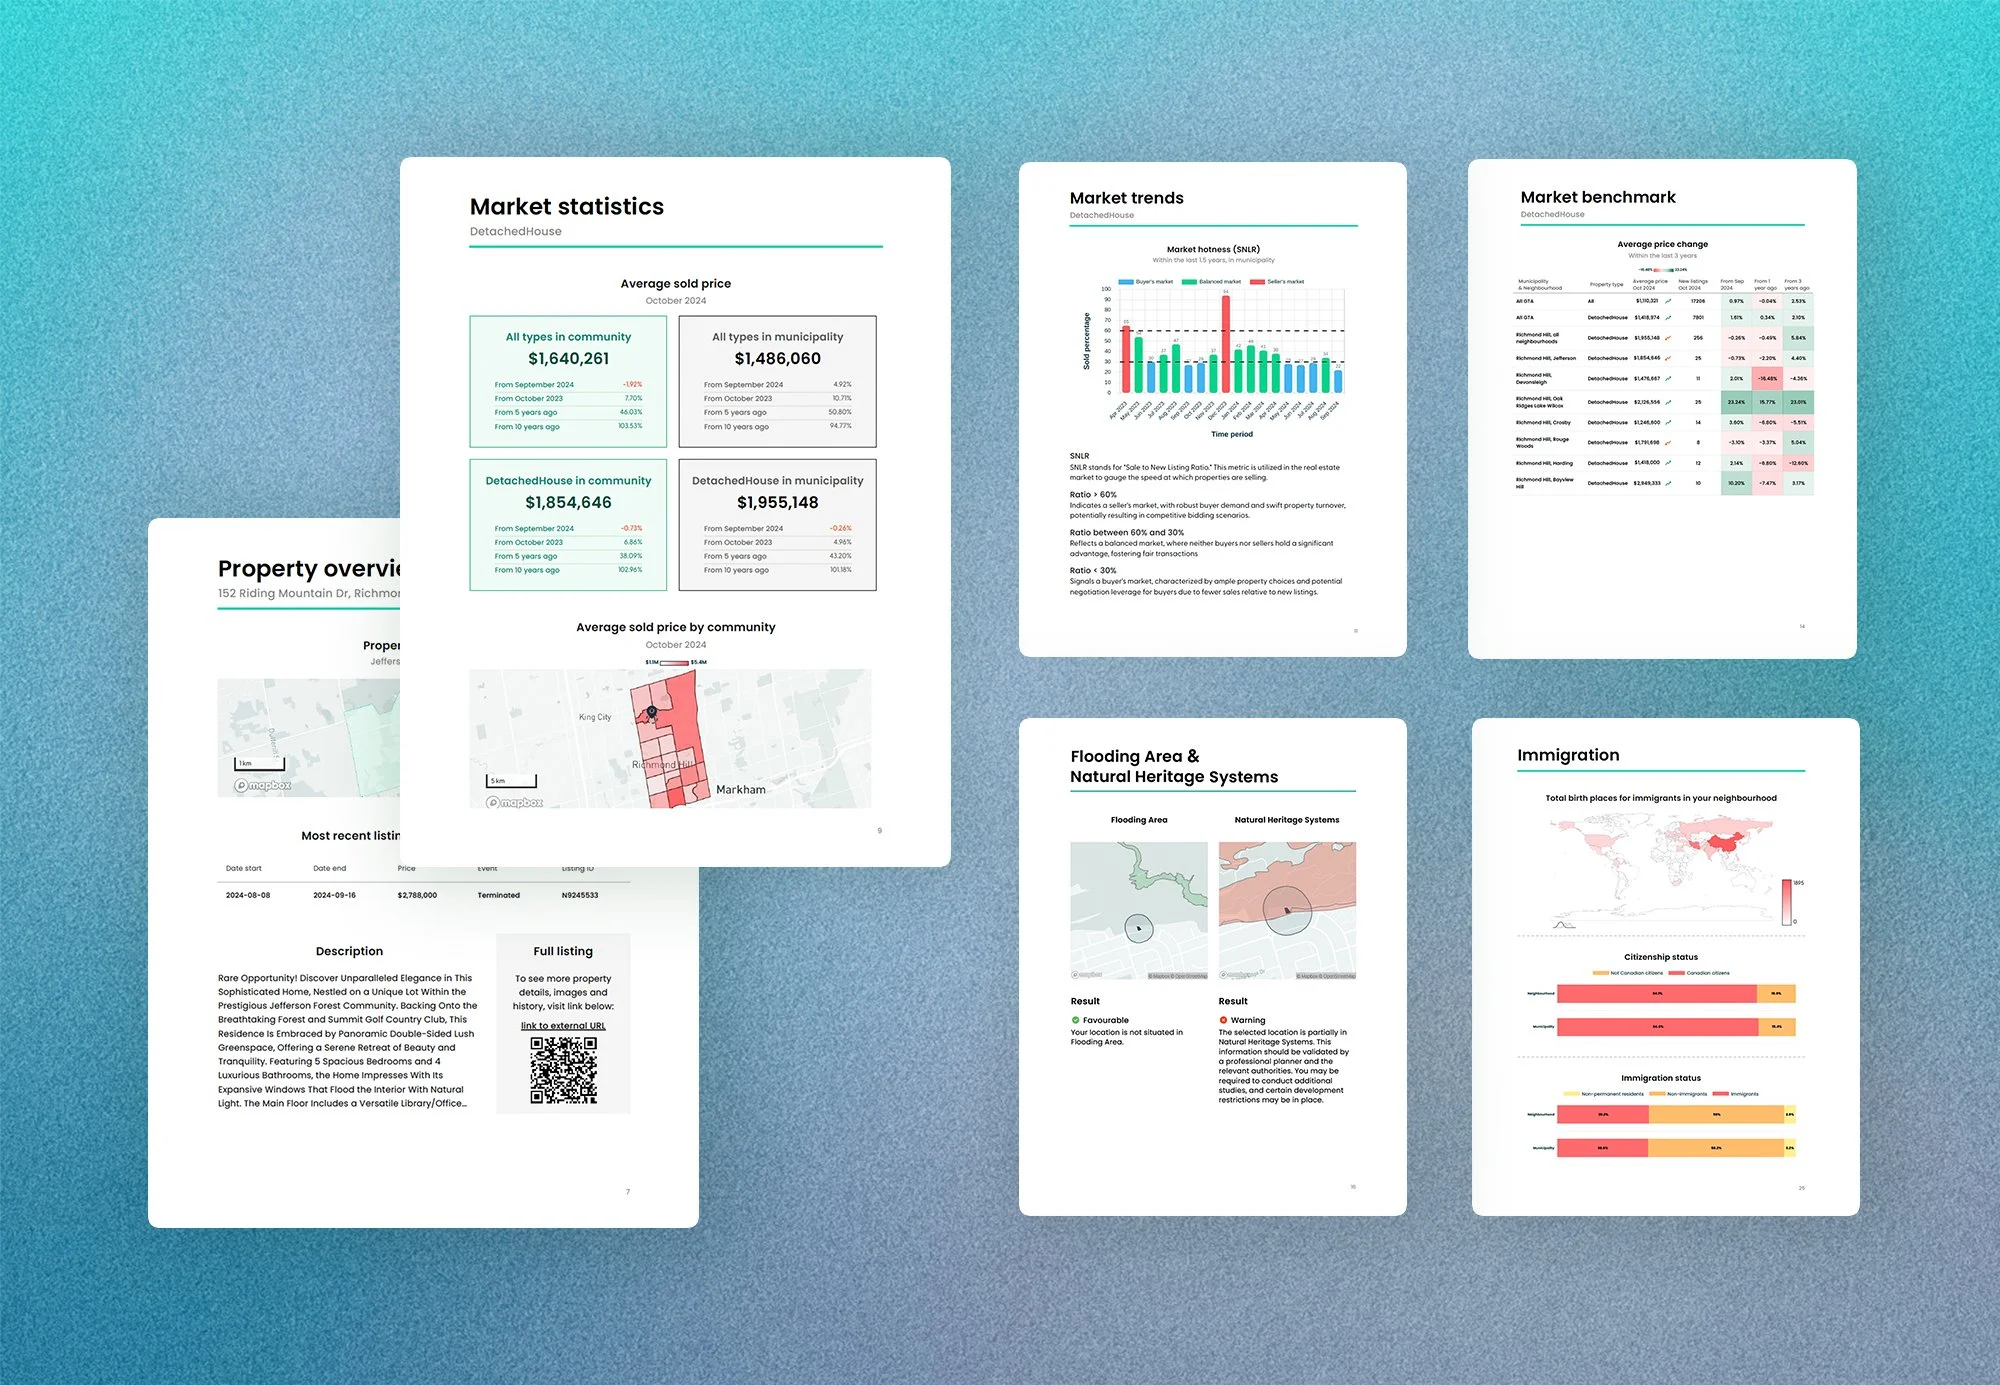
Real estate report
Offer exclusive real estate reports.
Get property details, market values, key land analytics and a demographics overview—all rolled into one. The perfect tool for providing a well-rounded property snapshot to your clients.
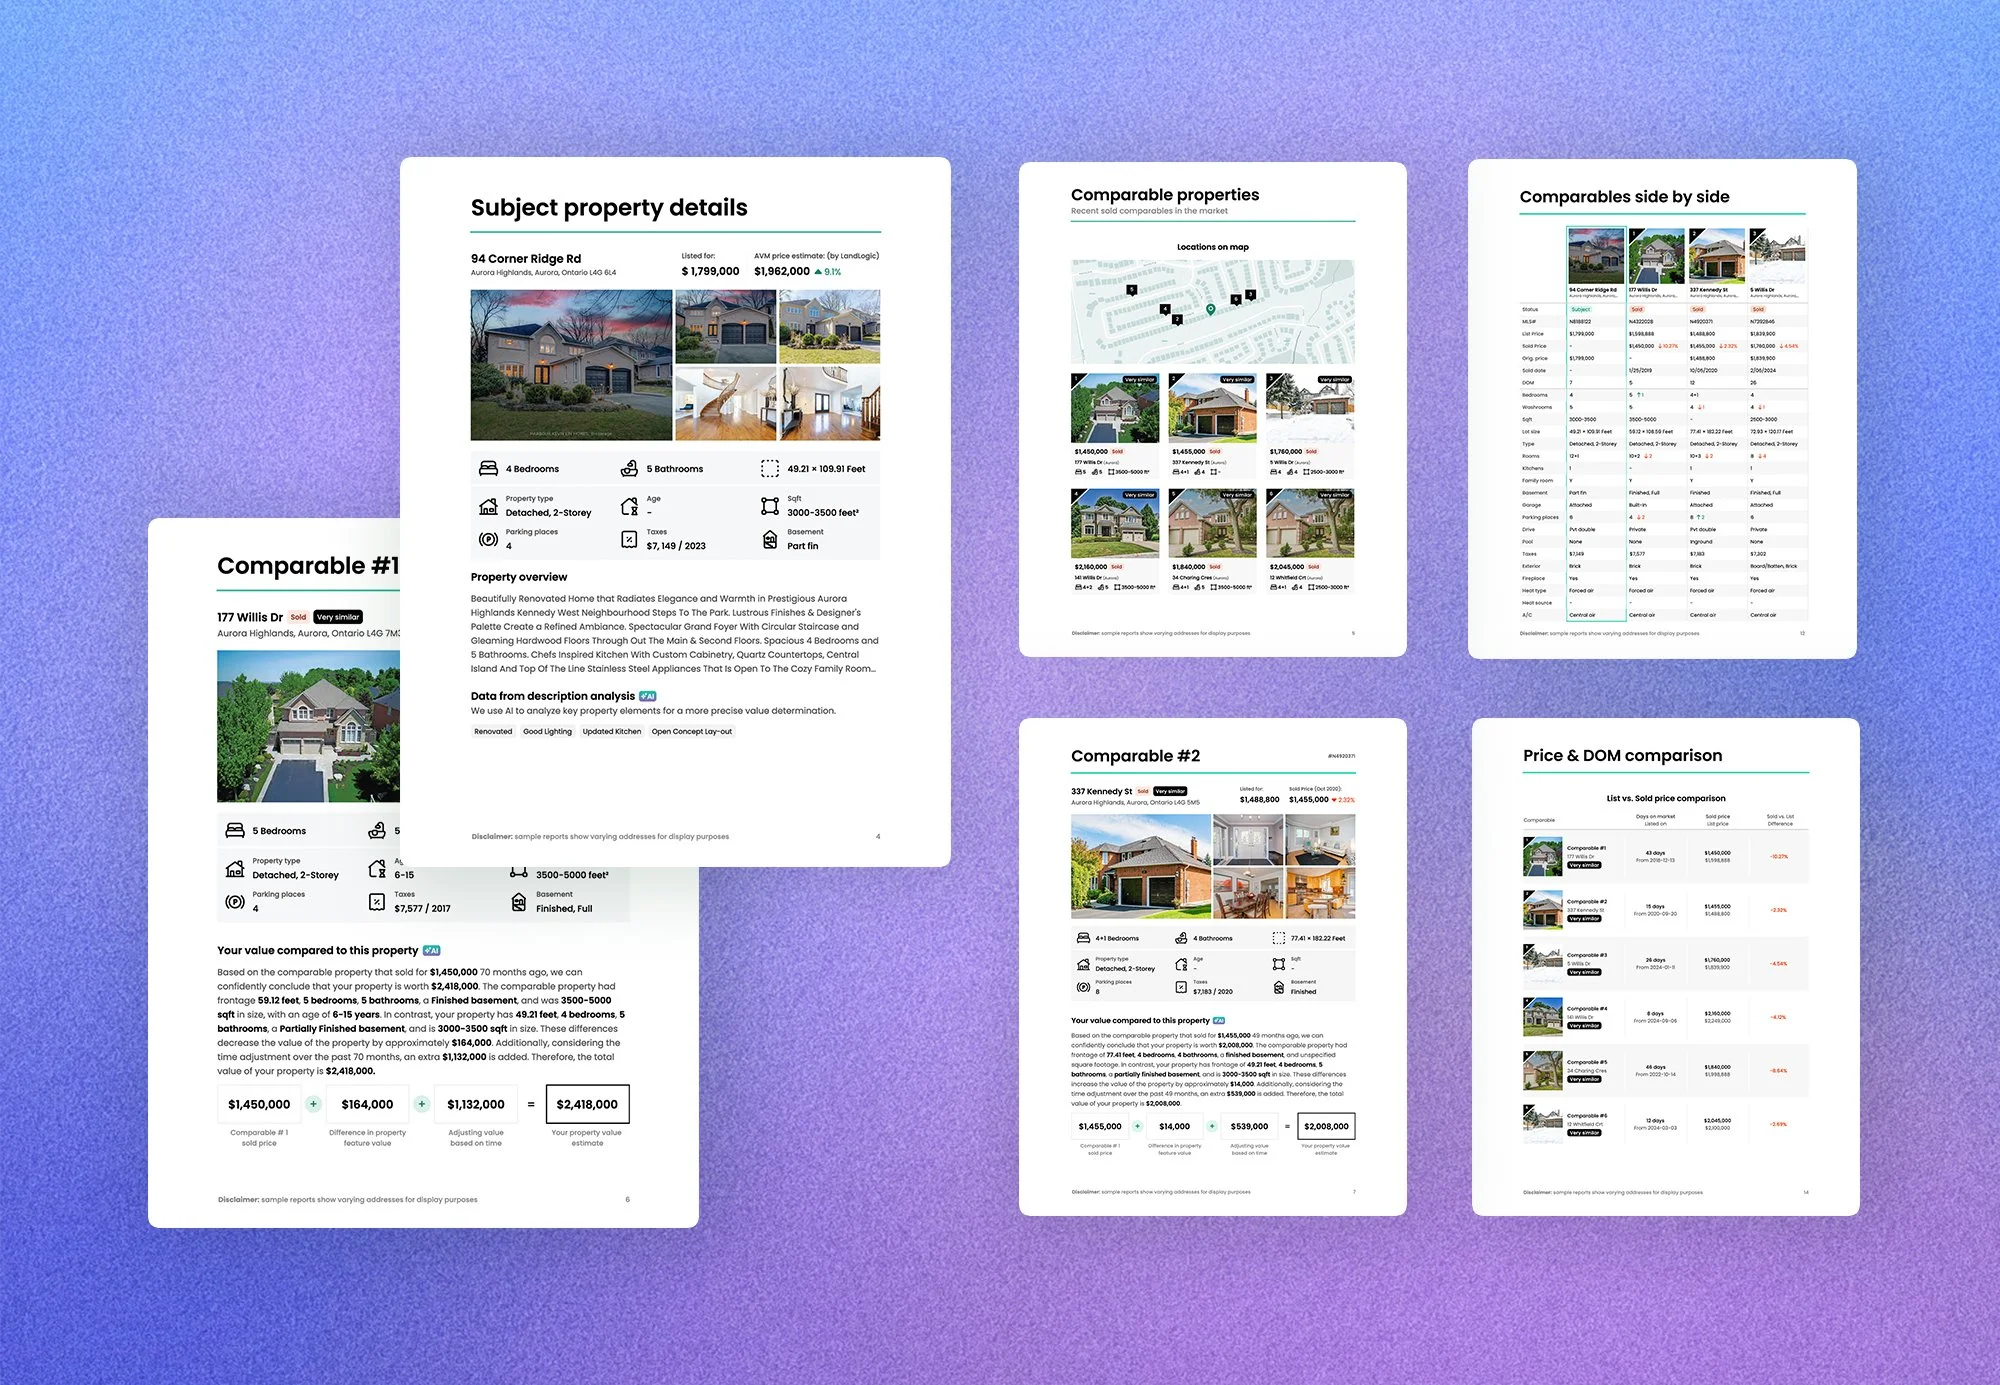
CMA report
Work faster with automated CMAs.
Generate similar properties—in seconds. Automatically adjust for difference in sale price, property features and date sold. Use it out-of-the-box, or customize it yourself.

FAQ
Answering all your questions.
We’ve answered some of the questions that we get the most, but if you have a more specific query, don’t hesitate to contact us.
-
Our database feeds off official live data sources, and are updated as soon as changes become public. So you can rely on our data just as you would the municipality’s own website. We’d be happy to discuss our data schedules in more detail if you’d like to contact us.
-
Yes, we offer APIs that allow users to harness our data, reports and conversational AI within their own platforms. To see an example, read about our integration with Teranet. We’d be happy to set this up for you. Please contact us to set up a demo for integration.
-
LandLogic uses proprietary AI processes to clean, normalize, and standardize fragmented datasets so you can work with them instantly. Instead of hunting through PDFs, maps, and disconnected sources, you get consolidated property information that is consistent, searchable, and ready for analysis across regions. It’s the kind of structured data most organizations simply don’t have access to today.
-
LandLogic standardizes the rules and information behind every property, so you can verify constraints and requirements in minutes. Instead of manual lookup and interpretation, you get simple-to-understand insights that remove uncertainty and make the process faster, clearer, and less error-prone. In short, it saves you time, effort and resources.
-
Traditional planning and GIS tools show you maps and raw data. LandLogic shows you answers. Instead of interpreting raw layers or combing through zoning bylaws, you get answers based off a specific parcel: what the rules are, how they apply to the property, and what’s possible. All the information is consolidated for you.
-
We have over 80 municipalities in our database, mainly across Ontario, but expanding across Canada. You can make a free trial account to see which areas are currently covered. We are constantly adding regions, and you can contact us to discuss coverage in a new area.
Sometimes you may notice “missing” datasets in certain areas, and that is because they are not yet made available by the municipality. But LandLogic will always be updating its database as soon as data becomes publicly available.
-
No. The Data Studio is built for professionals who need clarity, not complexity. Everything is presented in a clean, intuitive environment so you can move from search to understanding without wrangling spreadsheets or code. But if you have any issues, our team is ready to help!
-
The platform brings zoning, planning, and key property information together so you can search and filter easily, which makes it easy to compare parcels and find opportunities that match your criteria. It alleviates your pain-staking manual research and dramatically speeds up the early stages of any land or property evaluation.
-
A subscription gives you access to the full platform, including site selection tools, interactive site assessment maps, multiplex assessment, and discounts on downloadable reports. It’s everything a land professional needs to move from search to decision quickly. Try a free trial to test it yourself!
-
Anyone who acts as a land-use consultant doing regular due diligence, site selection and property research. That could be brokerages, economic development teams, builders, planners, developers, and more. Our subscription is designed to service those who do property research frequently, and our on-demand reports are available for those who just needs reports.

Create an account instantly to get started today, or contact us to get a demo of any of our tools